When dotPeek can save your live
This post is a little break in my investigation regarding auth stuff.
To write my previous posts I had to debug a bit - and this mainly happened with code that was not mine. Debugging javascript code that is not your own is a piece of cake. You simply write debugger somewhere in the script and that’s it - the execution of this code will stop where you place the word debugger. Eventually, you can set a breakpoint in the web browser debugger. Debugging C# code that is not your own requires more involvement, especially if you don’t have source code and pdb files. In this post, I am going to write how
dotPeek helps to look inside 3rd party code and see how things works in libraries that I have imported to my project.
dotPeek is a decompiler but it can also work as a Symbol Server. Before you use it, you must set it up. This how I did it:
To configure dotPeek as a Symbol Server you must navigate in Visual Studio to Tools → Options → Debugging → Symbols. And then add a new location for symbols like this:
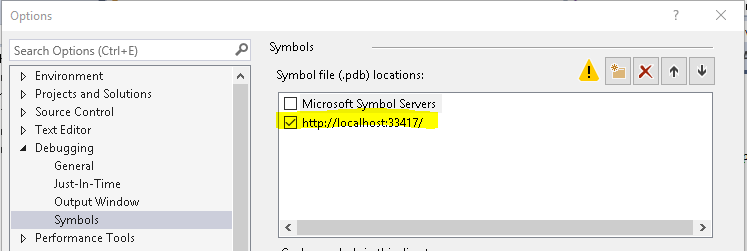
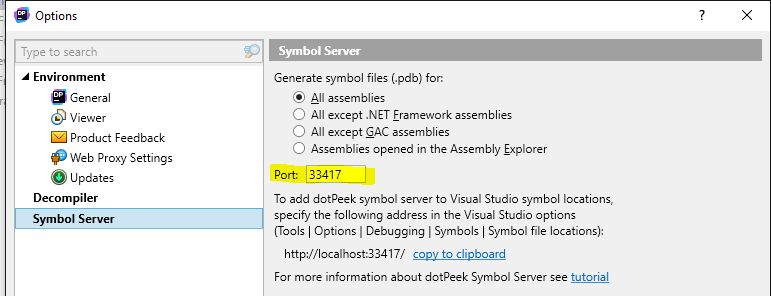
You can check the port on which the symbol server is working in the dotPeek settings Tool → Options → Symbol Server
The debugging options in Visual Studio (Tools → Options → Debugging → General) should be set like this:
Uncheck the Enable Just My Code option
Uncheck the Enable .NET Framework source stepping option
Check the Enable source server support option
Uncheck the Require source files to exactly match the original version
Now when everything is setup you can start symbol server in dotPeek by hitting this button:

When you first run debug after this configuration it takes some time to load all the desired symbols. You can see what’s going on at the bottom left corner of Visual Studio.

When all the symbols are loaded, you will see this:
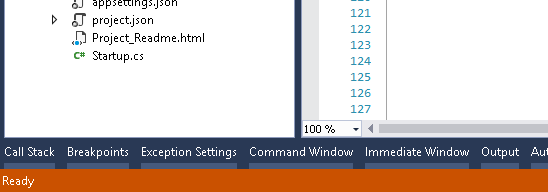
Next time when you hit Run debugging, it will start almost immediately.
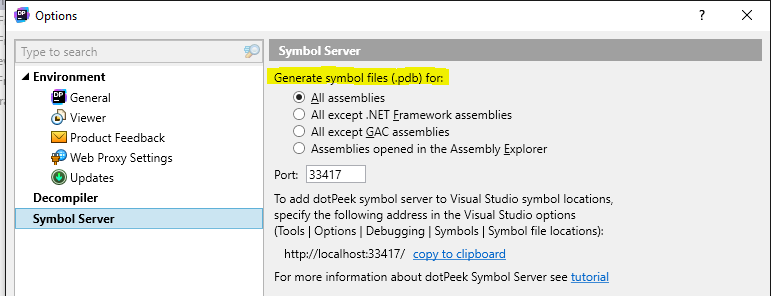
You can control which symbols should be loaded in the dotPeek settings Tool → Options → Symbol Server and here you can choose for which assemblies dotPeek should generate symbols.
When you do this setup it doesn’t mean you can enter whenever you want by hitting F11 (Step Into). You still must show where the pdb file is for a specific assembly. To do this, open Debug → Windows → Modules during the debugging session and in the Search field type a part of the name of the assembly you want to debug. After, you’ll see in the Modules window Cannot find or open the PDB file., for this assembly.

Fortunately, dotPeek comes to the rescue. Go to File → Open in dotPeek and navigate to the path where the assembly you want to debug is. You’ll find this path in the Debug → Windows → Modules as you can see here:

When you select the .dll file it will be loaded to the dotPeek Assembly Explorer:
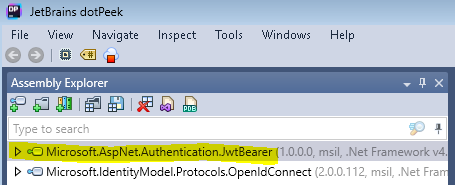
Now you can load the pdb for this assembly in Visual Studio. In Debug → Windows → Modules, right click on the selected assembly and you will see this dialog:
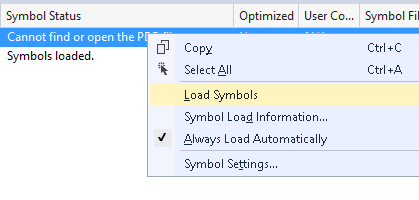
Clicking on Load Symbols succeeds in loading symbols for the assembly you want to debug.

After this, when you hit F11 (Step Into) you’ll get inside the code of the assembly you want to reflect.
Sometimes you cannot find a direct way from your code to the methods writting by others, which you want to investigate. In this situation, you can use the window Debug → New Breakpoint → Function Breakpoint….

In this window, you can put the fully qualified method name and the debugger will stop at that point when the execution of the application has reached it.
What’s more, if you want, you can generatepdb files in dotPeek and save it. To do this, right click the mouse button on the assembly for which you want pdb. You’ll see this dialog:
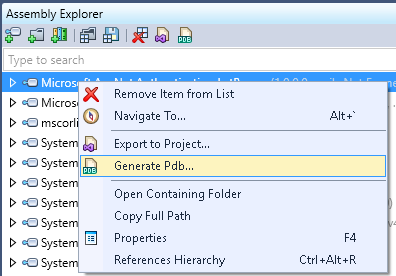
When you click Generate Pdb.. you’ll be asking to pass the destination path for symbols. You should specify the same path where the assembly is located.
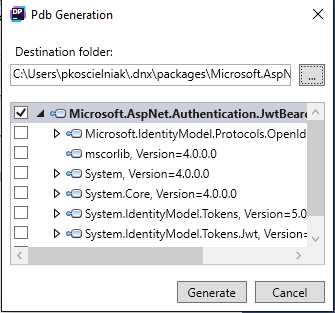
Clicking Generate will cause the pdb file to be generated and copied to the chosen location. By doing this, you can pass this pdb file where it is needed.
Now, you can enjoy the freedom of debugging.
Related posts:
- Enrolling in "Daj się poznać"
- "Daj się poznać" - Project details"
- I'm holding a Project Rider EAP
- Installing ASP .NET Core 1 on Ubuntu 14.04
- My first ASP NET Core 1.0 web application
- Project setup - server-side
- Project setup - client-side
- Adding styling to my application
- Angular 2 Confirm Dialog Component
- Before going into production
- Publishing to Azure
- Setting up the Web client for Google Identity Platform
- oidc-token-manager library with Google Identity Platform - Part 1
- oidc-token-manager library with Google Identity Platform - Part 2
- Accessing API with token from Google Identity Provider
- How portable is ASP .NET Core 1.0?
- When dotPeek can save your live
- Reading code as if it were a book
- ASP .NET Core Configuration
- Getting started with IdentityServer4
- IdentityServer4 - accessing API
- Dealing with secrets in ASP .NET Core
- Google Identity Provider with IdentityServer4
- Upgrading to Angular2 RC1
- Experimenting with Angular2 CLI
- Migrating to ASP .NET Core RC2
- Epilogue: Daj się poznać series

Comments
comments powered by Disqus